Merrymeeting Bay / Kennebec Estuary Research Program (Bowdoin)

Student Research
Distribution of Submerged Aquatic Vegetation in Merrymeeting Bay
Mary Kate Wheeler
Biology Department, Bowdoin College, Brunswick, ME
Summer 2005
 |
| Submerged aquatic vegetation (SAV) plays an important role in aquatic ecosystems by producing oxygen, absorbing nutrients and reducing turbidity. SAV beds offer food and shelter to aquatic invertebrates and provide important nursery habitat for juvenile fish. Although SAV has a high ecological value, little is know about the distribution or function of SAV beds in Merrymeeting Bay. |
BACKGROUND:
Located in mid-coast Maine, Merrymeeting Bay (MMB) is a unique freshwater tidal ecosystem occurring at the confluence of six rivers 30 km inland from the coast [Fig. 1]. Covering a vast area (4330 ha), MMB is a dynamic system with a history of severe environmental damage. Beginning in the late 1800s, the ecosystem suffered from high levels of pollution associated with industrial and municipal development along the Androscoggin and Kennebec Rivers, which empty into MMB (Lichter et al. in prep). In the 1970’s, the water quality of MMB began to recover gradually following implementation of the Clean Water Act.
While little is known about the history of SAV in MMB, SAV in the Chesapeake Bay has been studied in detail, due in part to a dramatic decline in the SAV population in the 1960s and 70s (Orth and Moore, 1983). According to a study of sediment cores in the Chesapeake, sedimentation and nutrient loading increased dramatically following European colonization. As land was cleared and fertilized for agriculture, turbidity in the Bay increased and light became limiting for SAV. Eventually light limitation caused SAV populations to decline substantially, and the Bay shifted from a benthic food web to a primarily planktonic system (Brush and Hilgartner, 2000).
While the land surrounding MMB has suffered less human impact than the Chesapeake Bay area, it is likely that SAV populations in MMB have been affected by human activity. Increased sedimentation and nutrient loading in MMB may have reduced the area of habitat available to SAV by increasing water turbidity. The purpose of this study is to examine the current distribution of SAV in MMB in order to further our understanding of this system.
 |
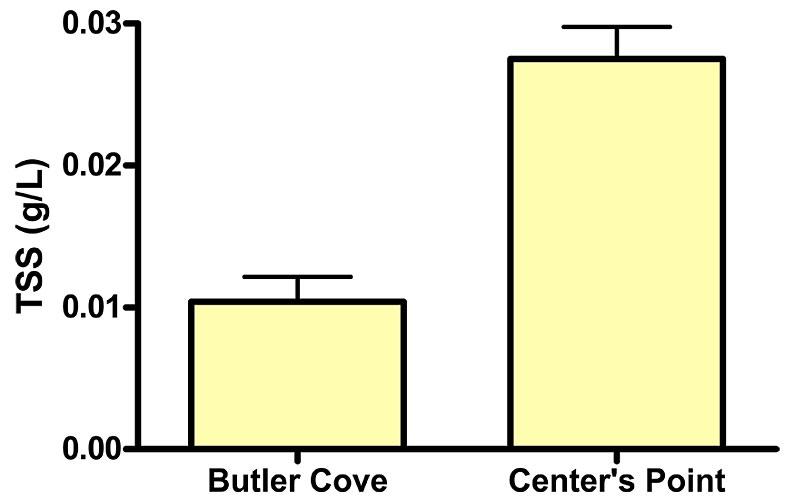 |
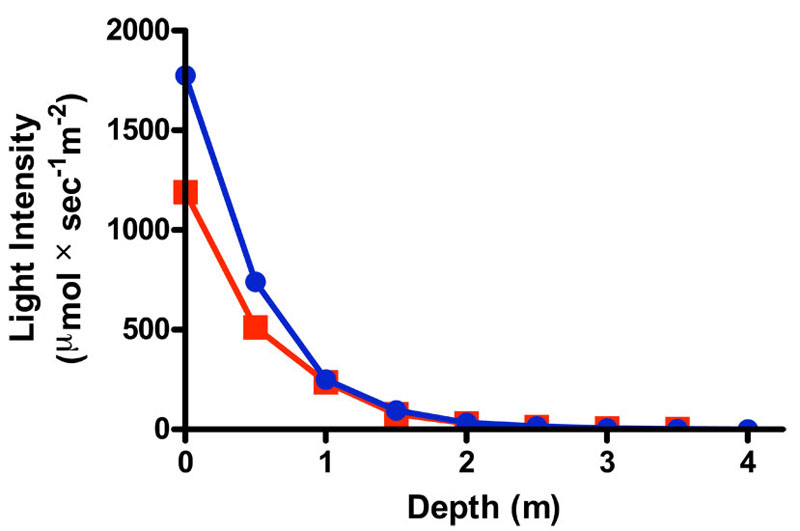
| Figure 2. Underwater light availability at BC (red squares) and CP (blue circles). | Figure 3. Mean total suspended solids (TSS) at BC and CP. TSS were greater at CP than at BC (unpaired t-test, P<0.001). Error bars represent 1 SE. |
PROJECT GOALS:
Determine the location of SAV beds in Merrymeeting Bay.
Measure the productivity of SAV beds by sampling plant biomass.
Examine relationships between SAV biomass and various environmental factors.
 |
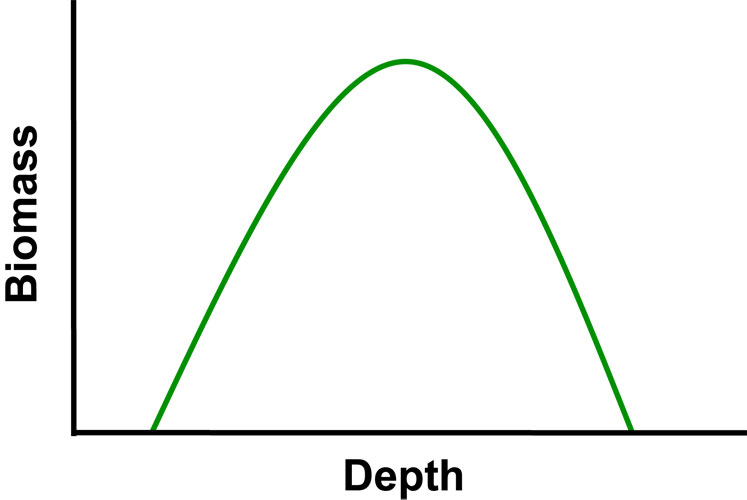 |
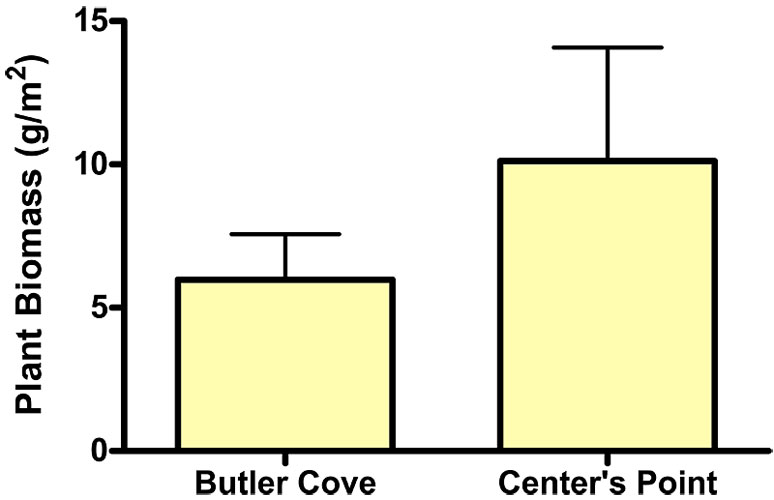
| Figure 4. Mean SAV biomass at BC and CP. There was no significant difference in SAV biomass between the two sites (unpaited t-test, P=0.31). Error bars represent 1 SE. | Figure 5. Expected distribution of SAV biomass versus depth. |
METHODS:
Phase I
A series of aerial color infrared photos taken in 1998 were used by the Sewall Company in 2000 to classify land use and vegetation type in and around MMB. We used copies of these photos in the field to look for areas classified by the Sewall study as ‘aquatic beds.’
Phase II
After several weeks of ground truthing the Sewall data, we chose 2 study sites in MMB: Butler Cove (BC) and Center’s Point (CP) [Fig. 1].
Transects parallel to shore were set up at each site and a number of 0.25m2 plots along each transect were sampled haphazardly.
All plant material in each plot was harvested, water and sediment samples were collected, and water depth and underwater light intensity were measured.
Light measurements were taken every half meter in a deep plot at each site to determine underwater light availability.
Plant biomass, total suspended solids (TSS), sediment composition and depth at low tide were calculated for each plot.
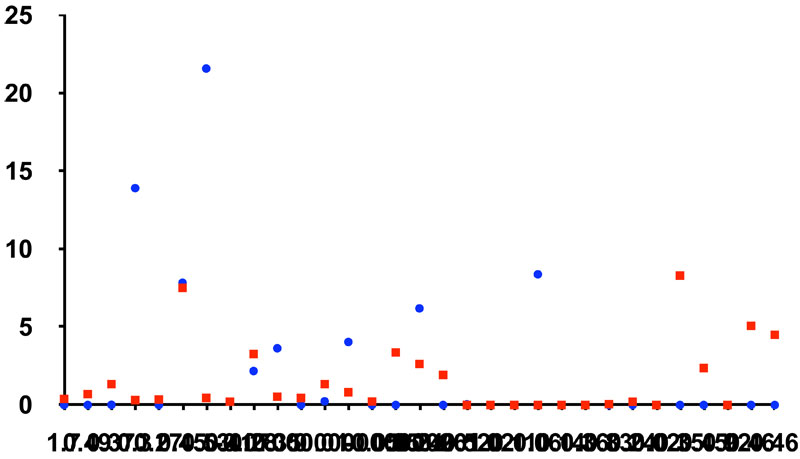 |
| Figure 6. Actual distribution of SAV biomass versus depth for sample plots at BC (red squares) and CP (blue circles). |
RESULTS:
Out of all the locations where we searched for plants, we found SAV at almost every site indicated by the Sewall study as an ‘aquatic bed’ [Fig. 1].
Light intensity decreased logarithmically at BC and CP [Fig 2]. At both sites light intensity was very low (< 35 umoles per second per m2) at depths over 2m.
TSS were greater at CP than at BC [Fig. 3]. However, the light profiles at the two sites were similar, which suggests that the variation in TSS between the two sites was not great enough to impact light penetration.
While mean SAV biomass was greater at CP than at BC, the difference was not statistically significant [Fig 4]. The greater biomass at CP could be explained by the later sampling date.
The expected relationship between SAV biomass and water depth was a unimodal curve [Fig. 5]. The actual distribution did not fit that pattern because there were low-biomass plots at every depth, indicating a patchy distribution [Fig. 6]. However, plants were observed only in one plot with a depth at low tide greater than 1m, and the biomass in that plot was very low (0.212g/m2).
Spatial data indicate
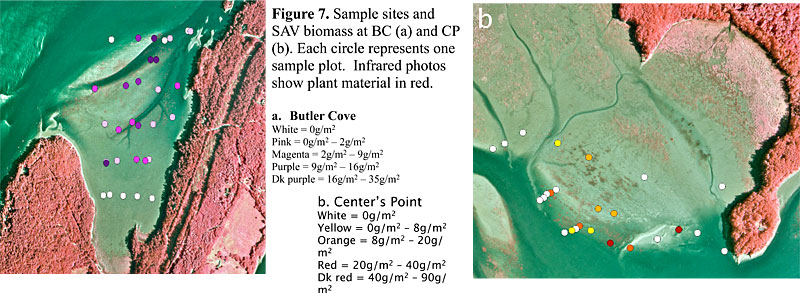 |
| Figure 7. Sample sites and SAV biomass at BC (a) and CP (b). Each circle represents one sample plot. Infrared photos show plant material in red. |
FUTURE GOALS:
Continue looking for SAV beds throughout MMB
Sample more plots in Butler Cove and Center’s Point
Construct a bathymetric map of Butler Cove and Center’s Point
Transplant experiments
Reconstruct the history of SAV in MMB using sediment cores
WORKS CITED
Brush, G. and W. Hilgartner (2000) Paleoecology of submerged macrophytes in the upper Chesapeake Bay. Ecological Monographs 70(4):645-667.
Lichter, J., M. Klingle, S.L. Rodgers, T.S. Squiers, Jr., and C.S. Todd (2005) Three hundred
years of ecological degradation, thirty years of recovery: The history of a freshwater
tidal ecosystem in mid-coast Maine. Environmental History, in preparation.
Orth, R.J. and K.A. Moore (1983) Chesapeake Bay: an unprecedented decline in submerged aquatic vegetation. Science 222(4619):51-53.
Sewall Report
Acknowledgements:
Jaret Reblin
John Lichter
Heather Caron
Lucy VanHook
Funding provided by a Rusack Fellowship.