Merrymeeting Bay / Kennebec Estuary Research Program (Bowdoin)

Student Research
The impacts of human and climatic influences on the recent sedimentary record of Merrymeeting Bay
Katherine Loomis, Doherty Fellowship
Bowdoin College, Geology Department,
Summer Research 2005
Goals:
•Determine how the sediment record varies by location
•To characterize the influence of climatic events and human industrialization on the recent sediment record
 |
 |
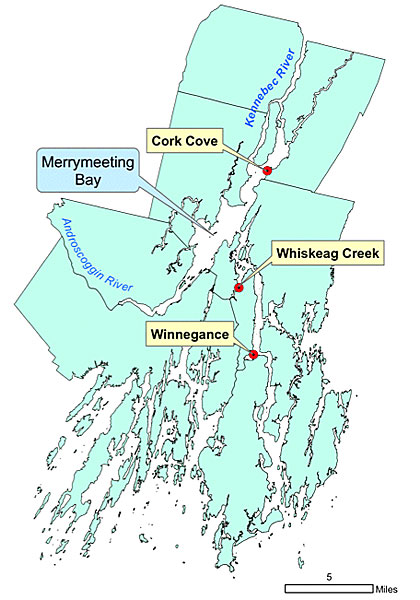
| Merrymeeting Bay is a unique freshwater tidal ecosystem caused by the confluence of six rivers. The incoming fresh water drains into the Gulf of Maine through the narrow opening of the Chops. The sediment record of the area has been influenced both by climatic events and by human impacts, beginning with European settlement and especially since the onset of industrialization. | |
Methods:
Three meter-long sediment cores from intertidal flats in the Merrymeeting Bay area were obtained and analyzed.
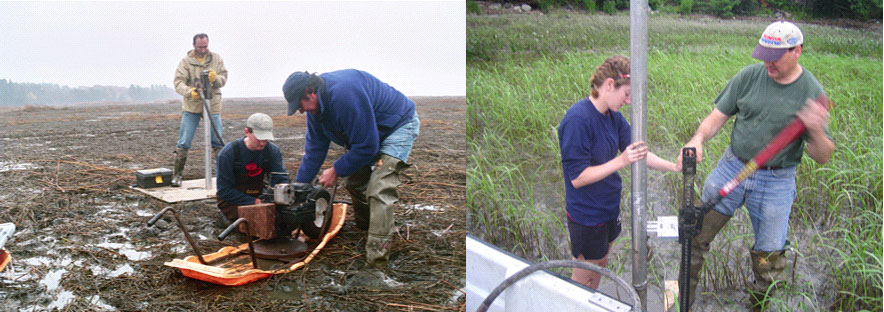 |
| Cores were retrieved in metal tubes with the Geology department's vibracorer to minimize compaction, then extruded and divided into centimeter-thick levels in the lab. |
 |
| Cores were analyzed for bulk density, sand content, fly ash particles, biogenic silica, and bio-available phosphorus, and samples were sent to other labs to be tested for heavy metals, carbon-nitrogen, and lead-210 dating. |
Results:
Results have not yet been received from the other labs, and the biogenic silica testing needs to be completed. Fly ash particles, indicating the onset of industrialization, were first observed between 30 and 40 cm in each core.
 |
| Figure. 2 Up velocity and backscatter at transect A. Data were taken from the maximum discharge during ebb tide (6/17/04) |
RESULTS:
Out of all the locations where we searched for plants, we found SAV at almost every site indicated by the Sewall study as an ‘aquatic bed’ [Fig. 1].
Light intensity decreased logarithmically at BC and CP [Fig 2]. At both sites light intensity was very low (< 35 umoles per second per m2) at depths over 2m.
TSS were greater at CP than at BC [Fig. 3]. However, the light profiles at the two sites were similar, which suggests that the variation in TSS between the two sites was not great enough to impact light penetration.
While mean SAV biomass was greater at CP than at BC, the difference was not statistically significant [Fig 4]. The greater biomass at CP could be explained by the later sampling date.
The expected relationship between SAV biomass and water depth was a unimodal curve [Fig. 5]. The actual distribution did not fit that pattern because there were low-biomass plots at every depth, indicating a patchy distribution [Fig. 6]. However, plants were observed only in one plot with a depth at low tide greater than 1m, and the biomass in that plot was very low (0.212g/m2).
Spatial data indicate
 |
| Figure. 3 Magnitude velocity and up velocity along transect A in comparison during neap tide (first column) and spring tide (second column). Data were taken during ebb tide when the discharges were maximum. |
FUTURE GOALS:
Continue looking for SAV beds throughout MMB
Sample more plots in Butler Cove and Center’s Point
Construct a bathymetric map of Butler Cove and Center’s Point
Transplant experiments
Reconstruct the history of SAV in MMB using sediment cores
WORKS CITED
Brush, G. and W. Hilgartner (2000) Paleoecology of submerged macrophytes in the upper Chesapeake Bay. Ecological Monographs 70(4):645-667.
Lichter, J., M. Klingle, S.L. Rodgers, T.S. Squiers, Jr., and C.S. Todd (2005) Three hundred
years of ecological degradation, thirty years of recovery: The history of a freshwater
tidal ecosystem in mid-coast Maine. Environmental History, in preparation.
Orth, R.J. and K.A. Moore (1983) Chesapeake Bay: an unprecedented decline in submerged aquatic vegetation. Science 222(4619):51-53.
Sewall Report
 |
| Figure. 4a, 4b Downwelling-subsection discharge and percentage at transect A. 5a data were collected during neap tide (6/17/04) and 5b data were collected during spring tide (7/1-2/04). |
Special thanks to:
Peter Lea, Elizabeth Harvey, Heather Caron, and the Doherty Foundation