Merrymeeting Bay / Kennebec Estuary Research Program (Bowdoin)

Student Research
Dynamics of Tidal and River Currents in the Region of The Chops at Merrymeeting Bay
Ratsirin Supcharoen
Geology Department, Bowdoin College, Brunswick, ME
Summer 2004
Backgrounds:
•Merrymeeting Bay is a freshwater tidal ecosystem in mid-coast Maine.
•The Androscoggin and the Kennebec River cover one third of watershed of the state.
•These rivers converge to the Merrymeeting Bay before drain to the Gulf of Maine through the narrow bedrock constriction of the Chops.
 |
| Figure. 1 All transects at the Chops. |
Goal:
To understand the flow dynamics during spring and neap tides at the Chops and in region to the north where water returning with the flood tide encounters seaward-flowing water of the major river channels.
 |
 |
 |
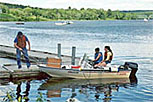
Methods:
•Conducting boat along transects (using GPS to navigate) over complete tidal cycles (12.50 hours) during neap (June 17, 2004) and spring tides (July 1-2, 2004)
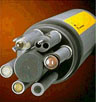
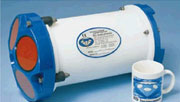
•Using Acoustic Doppler Current Profiler (ADCP) to measure 1) magnitude and direction of the tidal and river flows 2) backscatter (particles in water)
•Using YSI sonde to measure salinity, temperature, pH, dissolved oxygen, turbidity, fluorescence
•Using Winriver and ArcGis software to analyze and visualize data
 |
| Figure. 2 Up velocity and backscatter at transect A. Data were taken from the maximum discharge during ebb tide (6/17/04) |
Results:
The maximum discharges were 3843 and 5261 cubic meters during neap tide and spring tide, respectively. The pattern of tidal and river currents at the Chops was the same for both spring and neap tide: the discharge increases with the velocity magnitude. During spring tide, however, the magnitude of currents and the amount of discharge were greater than during neap tide (fig. 3). During ebb tide, the Kennebec and the Androscoggin discharge rushed out to the ocean through the Chops, causing the foam line along the Chops channel (fig.1). The formation of the foam line corresponded to the downwelling at the center of the Chops channel (fig.3). The downwelling and upwelling also push the particles in water columns along with the current movements (fig.2). Using the downwelling-subsection to identify the amount of river discharges, the discharge from the Androscoggin was about 60 percent of the total discharge, while the discharge from the Kennebec was about 40 percent (fig. 4).
 |
| Figure. 3 Magnitude velocity and up velocity along transect A in comparison during neap tide (first column) and spring tide (second column). Data were taken during ebb tide when the discharges were maximum. |
Conclusions:
During the flood tide, the tidal current rushes into the bay through the Chops channel and mainly flows through the Kennebec and the Androscoggin channels. The tidal current also influences the erosion and sand deposition in the northwest region of the Chops.
During the ebb tide, the discharges from both rivers strongly flows from their channels to the chops, causing the downwelling at the middle of the chops channel. The downwelling is caused by the pressure gradient of the river discharge at the middle of the chop pushing the water mass down to the bottom.
Interestingly, the discharge from the Androscoggin is greater than the discharge from the Kennebec although the Kennebec channel is wider and deeper. The reason for the greater discharge from Androscoggin might be the boarder region on the Androscoggin in the southwest area of the Chops.
 |
| Figure. 4a, 4b Downwelling-subsection discharge and percentage at transect A. 5a data were collected during neap tide (6/17/04) and 5b data were collected during spring tide (7/1-2/04). |
Acknowledgements:
Professor Peter Lea, Geology Department. Summer 2004 Doherty Fellowship. Chris Proctor, Owen McKenna, and Holly Kingsbury.