Merrymeeting Bay / Kennebec Estuary Research Program (Bowdoin)

Student Research
Flow Dynamics in the Kennebec River
Holly Kingsbury, with Professor Peter Lea
Summer 2004
QUESTIONS TO ANSWER:
How does tide change influence
river flow (sediment, fronts, etc)?
What is the Kennebec’s contribution to Merrymeeting Bay?
How Water Moves |
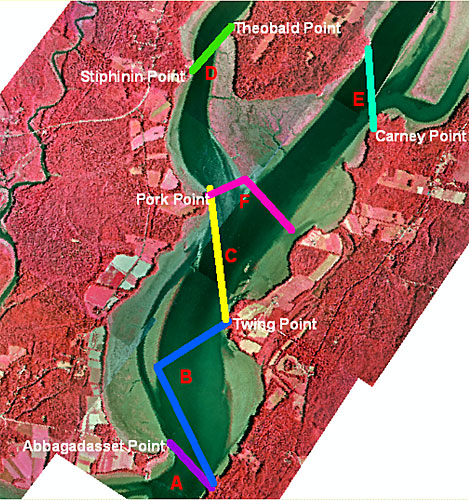
Transects |
 |
 |
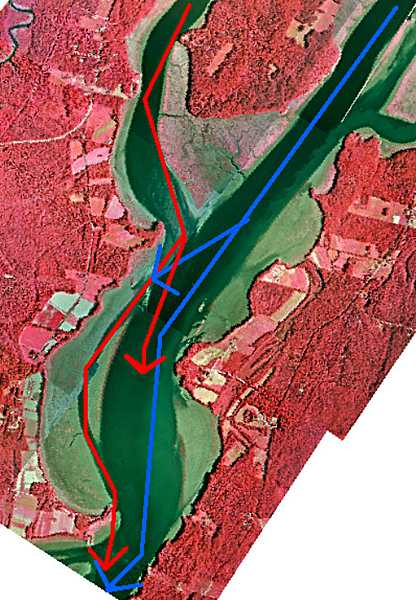
| - Water from the East channel (blue) flows down the deep main channel and pushes water from the West channel (red) down a narrow side channel - The water in the narrow side channel rips around Abby Point at its outlet, bringing lots of sediment and high velocity |
METHODS/TOOLS:
ADCP (Acoustic Doppler Current Profiler)
-Creates a 3D profile of the water using sound waves
-Measures depth, water velocity, water direction,
sediment/particle content
YSI sonde
- Measures temperature, salinity, pH, dissolved oxygen, turbidity, chlorophyll
Collect data during neap tide (06/18/04) and spring tide (07/02/04)
between Abbagadasset Point and Swan Island
IDEAS FOR FUTURE RESEARCH
Swirling currents that form at Abby Point
when tide is going out
Large number of up and down-welling
fronts during the spring tide
The narrow channel on the west side
of the river
Total discharge of river combined with
the Androscoggin through Chops
| Backscatter profile, Abby Point (07/02/04, 23:15-23:19) |
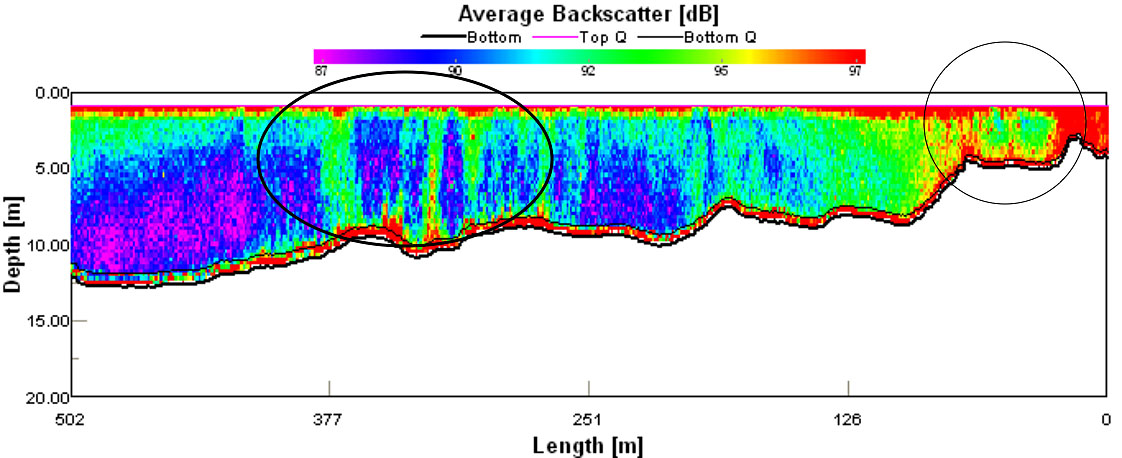 |
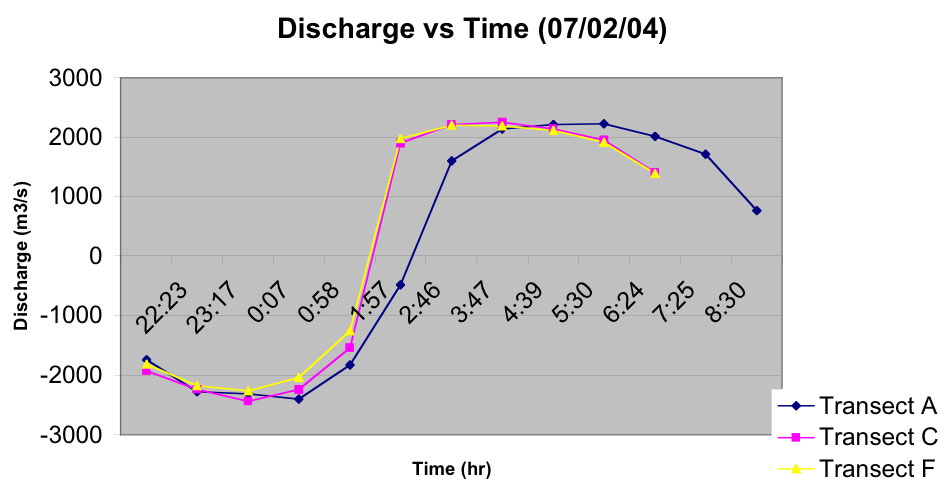
| Sediment decreases as the tide comes in and reaches its low at slack tide. As the tide goes out, the amount of sediment increases. The 2200 m3/s maximum discharge at Abby Point correlates |
 |
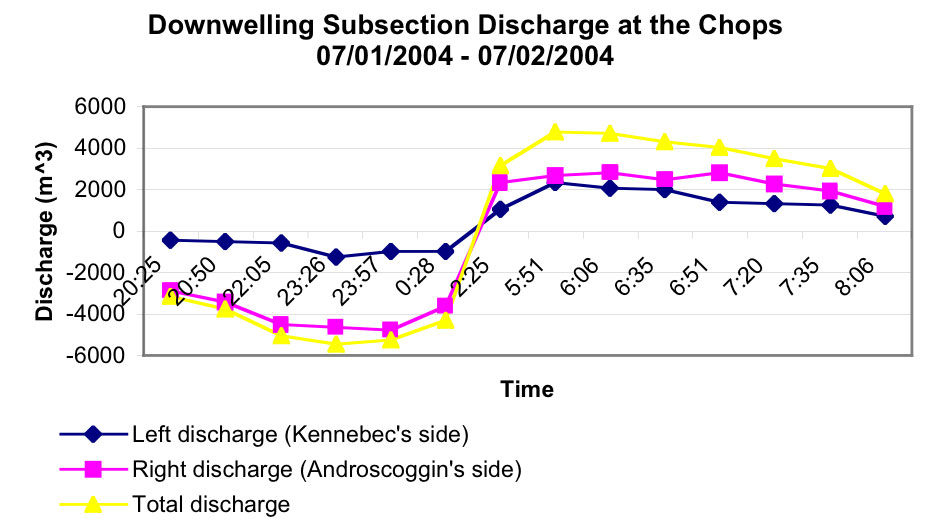 |
| The 2200 m3/s maximum discharge at Abby Point correlates with the 2200 m3/s in the Chops from the Kennebec. Maximum discharge occurs when the tide is going out, shortly after the tide changes |
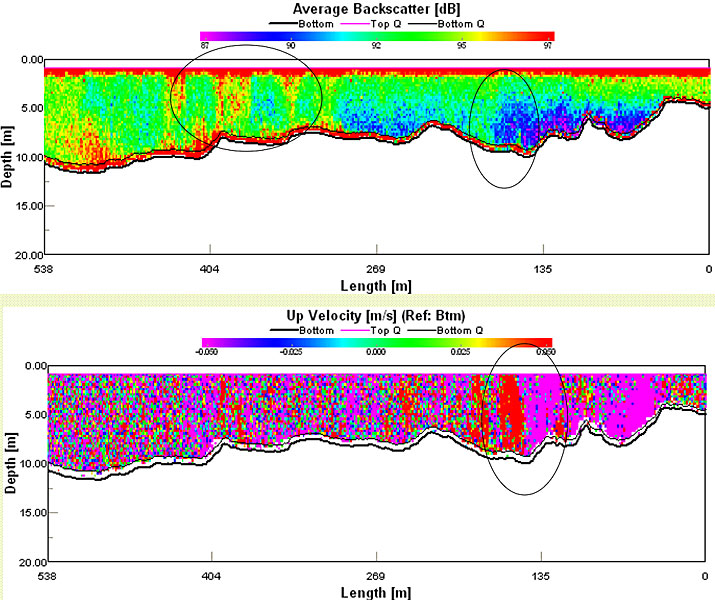 |
| Downwelling occurs when two different water masses collide. This occurs prominently in the Chops, but there are also signs of downwelling in the Kennebec channel. Upwelling usually occurs with downwelling, but is not as strong and does not move as much particulate matter |
YSI salinity data, 6/18/049:27-10:56 |
|
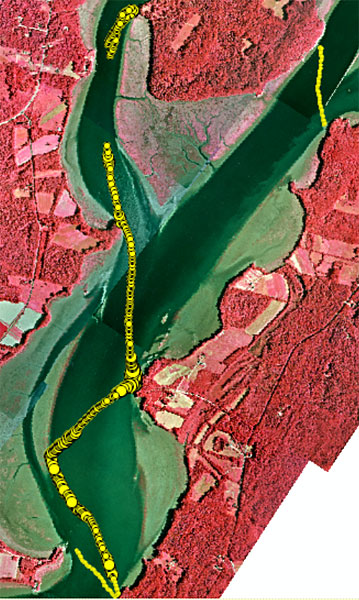 |
- YSI data is plotted onto aerial photos of the bay using GIS. Salinity increases as tide comes in and even after the tide change for 1 transect, then decreases as tide goes out. -Maximum salinity must be above transect F - Turbidity increases as tide comes in and decreases as tide goes out |
